Data Vizualization
In today’s data-driven world, how you show and share your data is critical in determining its overall impact and effectiveness. But just putting your data into charts and graphs isn’t enough.
Effective data visualization takes skill and storytelling, an eye for detail, and an understanding of your audience.
Start with the story you want to tell
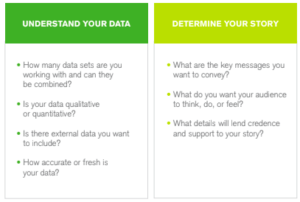
Whatever your specific goals may be, when you create a visualization, you’re really trying to capture a snapshot of your business – a quick, visual story that will drive understanding, discussion, and decision-making. To do this, you need to understand the data you’re working with and determine what story you want to tell. Start by asking a few questions.

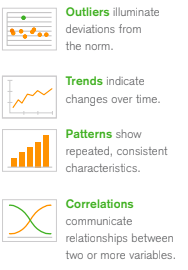
Good visualizations highlight relationships between data which can tell a powerful story.

If you wish to improve the design of your Qlik applications contact us to know more about our training & consultancy expertises !
Laetitia Larchanche


