Introduction :
In retail, one of the important measures is shelf space. Shelf share is the amount of space a product or brand occupies on a shelf or product family. For example, if my product occupies 20 cm of a shelf and competing products use 80 cm of the shelf, the shelf share for this product is 20%.
Presentation :
This measurement can be made on the basis of the number of references or on the basis of the number of occupied meters.
Making this measurement based on the number of references will allow to see how many references of our product are present and how many references of competing products are present. Carrying out this measurement on the basis of the number of meters will allow us to see how much space our product takes up on the entire shelf.
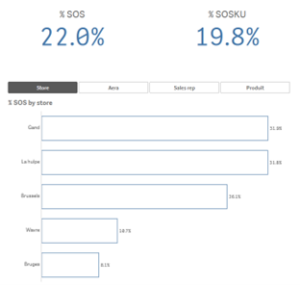
In the following example, “% SOS” (Share of Shelf) shows the number of products present compared to all competing presences.
The ” % SOSKU “, represents the place that my product takes, compared to the competitors on the shelf.

This bar chart can be viewed by store, by region, by sales representative, by product or by any other dimension desired.
But also …
Many visuals can be interesting for these measurements.
Here are some examples of analyses:
- The evolution of the SOS(KU) over time
- A comparative analysis where the user chooses the comparison he wants to make
- An analysis in amount, allowing to see the number of references and that of the competitors
- A report targeting the stores or products whose % SOS or % SOSKU is insufficient
Did you know it ?
Let’s reconstruct a past situation
It is possible to reconstruct a past situation. For example, it is possible to see what was the situation of the % SOS at the last visit in June 2022.
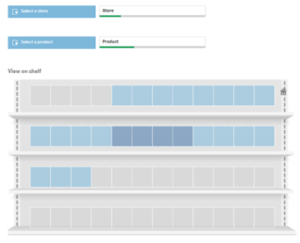
See the shelf like in the store
In Qlik, it is possible to make the department look like it is in the store.

Here we see in dark blue the products present for our product and also their position in the shelf.
We also see in light blue the competing products and their position.
In grey we see the other products.
Need a demo or a POC ?
For more information on the Qlik Insight, contact your Qlik consultant or Laetitia Larchanche at the coordinates below.
laetitia.larchanche@weqan.be
+32(0)489/970.736
Laetitia, Sales & Marketing manager
See our last articles :
- Newsletter : Septembre 2022
- Qlik Cloud® Release Notes – June, July and August 2022
- Nprinting® / QlikView® Release Notes – May 2022
