Qlik Cloud® Release Note – June, July and August 2022: What’s New:
Qlik Sense Saas® offers every month new features, always in a perspective of continuous improvement, we find again in this release some nice advances concerning Qlik Application Automation, Qlik Cataloque, Qlik reporting services or Snowflake.
In this article, we will see the main new features of June, July and August 2022.
June 2022 :
Full List : |
|
|
|
|
|
|
|
|
|
|
|
|
|
|
|
To remember :
- Hybrid Data Delivery is one of the most important features released in June, allowing greater flexibility between On-Premise data sources and your Qlik Cloud® applications. With no need to script or manipulate the data, it will be automatically cataloged, transformed into QVD format and stored, ready to use in your application in real time.
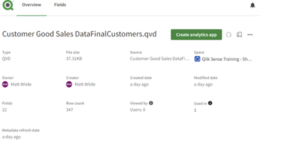
- Qlik Data Catalog is the primary interface for structuring all types of content in Qlik Cloud®, with some new features introduced, including the new metadata refresh option for datasets. This allows you to see when the dataset metadata has changed since the last known state.
This allows users to choose when to refresh derived metadata, and to know how up-to-date the metadata is. When a change to a dataset is detected, the refresh icon is green. If no change is detected and the metadata is up to date, the refresh icon will appear gray.
July 2022 :
Full List: |
|
|
|
|
|
|
|
|
|
|
|
August 2022 :
Full List: |
|
|
|
|
|
|
|
|
|
Original link to the release notes: https://help.qlik.com/en-US/cloud-services/Subsystems/Hub/Content/Sense_Hub/Introduction/saas-change-log.htm
To remember:
- Sample questions in Insight Advisor: Qlik Cloud® application developers will now be able to define sample questions in Insight Advisor in advance. This allows them to guide users in their research and analysis. It’s also a way to further customize the final output for customers.
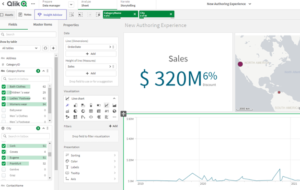
- Simplified authoring experience in Qlik Cloud®: The idea is to enable less experienced application builders to quickly design a sheet.
Only the most commonly used properties and visualizations are available and highlighted. One of the strong points is the easy access to all tables and their fields. Thus, one can have an overview of the data in the “sheet edition” mode, without having to go through the “Visualize”.

Screenshot of the new interface
Released in July 2022, it is since August that the simplified authoring experience is defined by default for the interface. This “Simplified Authoring” should therefore help you gain efficiency. The previous sheet editor is still available by clicking on the “Advanced Options” toggle button in the upper right corner.
If you want to learn more, we recommend the introductory video of the feature on Qlik’s YouTube channel: Introducing the new authoring experience in Qlik Cloud – YouTube
- Qlik Data Access Portal: Direct Access: You can now access data securely from a Qlik Cloud® application. With Direct Acces, you can establish an encrypted, mutually authenticated connection between your application and your server to obtain data behind a firewall.

Screenshot of the Direct Access
Analytics Data Pipeline
With these updates, Qlik continues to add and refine connections between applications and data. This can be seen in the frequent additions of new connectors and the securing of the connection, here with Hybrid Data Delivery, from June, or “Direct Access”, released in August.
A strategy that serves the flagship concept: “The Analytics Data Pipeline”. It continues to be more and more accessible, notably with the implementation of “Simplified Authoring” or the Qlik Data Catalog, which simplify and improve the user experience, for an increasingly fine barrier to entry.
The numerous help resources such as Qlik Community, the Qlik Education Forum or Qlik Help, also continue to be fed.
More info ? Here are three of our latest articles:
- Qlik Sense® Saas licensing for users outside of the DBA
- End of supports dates for Qlik Products
- What is the Signed License Key?

