
Human Ressources Analytics
People are the source of business success. To maximize the value of your most important business asset, HR and leadership must be able to deeply understand workforce effectiveness and confidently predict the impact of change.
We can see that the need for HR performance indicators is particularly present, for example : what is my absence rate? What is the cost of economic unemployment? What is the Bradford of the Y division? What is the Bradford by age group, gender or seniority?
However, this work is made all the more complex by the multiplication of data sources (accounting software, management tools, time clock data, ERP, etc.) and/or by the large number of employees. This has two consequences:
- On the one hand, the use of data compilation and calculation in a tool such as Excel is becoming more and more perilous.
- On the other hand, the use of reports specific to each management solution only covers their own perimeter and therefore does not allow for transversal analysis.
As a Business Intelligence solution Qlik provides human resources with a multi-source data collection tool capable of complex calculations on a large volume of data. Via an ODBC connection, Qlik can connect to most workforce management to extract the information and link it to other data sources.
Below are 3 dashboards illustrating how Qlik helps analyze the problem of absenteeism within the company.
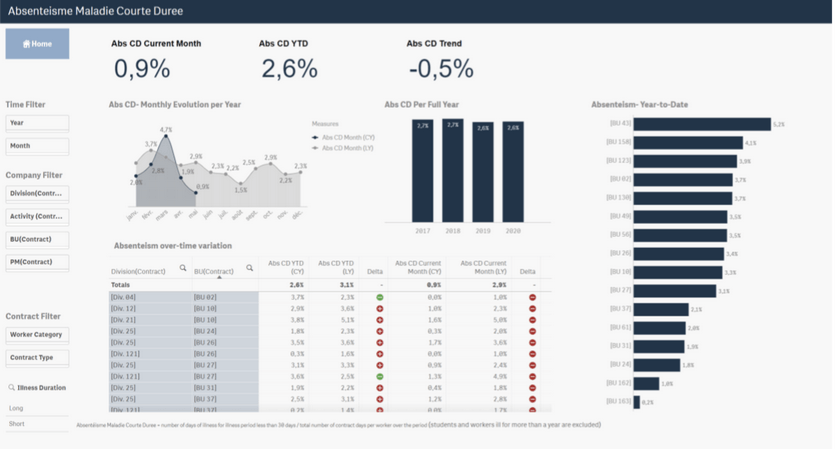
Attendance rate
Short-term absenteeism is a particularly important indicator because of the high cost to the organization:
- The first month of illness is at the expense of the employer.,
- Increased workload for the rest of the team (no replacement possible in the very short term),
- Additional administrative burden in HR.
For an employee for a given month, the absenteeism rate is calculated as the ratio between the number of days of absence and the number of days of planned benefits if the total number of days absent is less than 30 days for the same period of absence. In addition, there is the additional constraint that two consecutive periods of absence are to be considered as one and the same period of absence if they are separated by less than 14 days with a medical certificate stipulating a relapse or an extension. At the company level, this is calculated as the aggregation of the individual key figures.
The dashboard below compare the change in the short-term sickness absence rate from one year to the next via different axes: monthly, by business unit and by division. Note that the dimensions are hierarchical (called “drilldown”). This implies, for example, that clicking on a business unit will display the absence rate per manager working for this same business unit. Clicking on a particular manager will then display the absence rate of each member of his or her team. The analyst can thus use a top-down approach to granularity down to the finest detail.
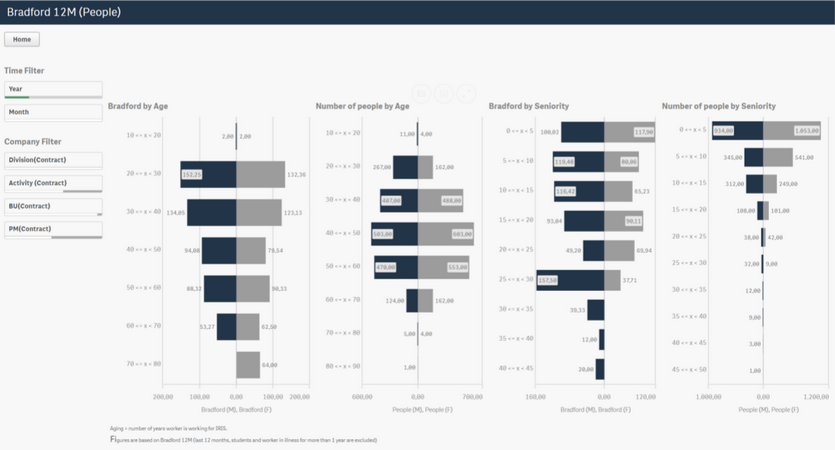
Bradford
In line with the absence rate, the Bradford is an absenteeism indicator that highlights the frequency of absences.Indeed, for the same number of days of absence, an employee who has had one and the same period of illness or seven periods of illness will not have the same organizational impact. Thus, the Bradford is calculated as follows:
- (number of absences due to illness)² X number of days of absence
At the company level, the Bradford is calculated as the average of the individual non-zero Bradfords. The advantage of Qlik is that this measurement can be calculated dynamically and along any relevant axis. In particular, it is possible to recalculate this measure by gender, age group, division, team, etc. This makes it possible to quickly identify a possible underlying problem.
The dashboard below highlights the Bradford by both age/seniority and gender. It can quickly be seen that the Bradford seems to decrease with age with no significant difference between males and females. It should be noted that the most represented age group, the 40-50 year olds, is not the group most affected by frequent absenteeism. On the other hand, seniority seems to play a more important role. It can be seen that men with 25 to 30 years of experience in the company are more prone to frequent absenteeism. Note : Qlik allows you to narrow the scope of the analysis, by “filtering” on a particular division, manager or year.
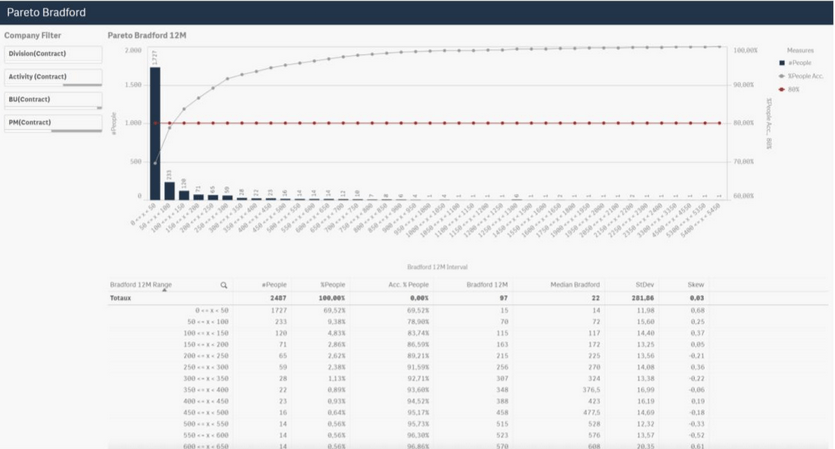
The following dashboard addresses the inverse analytical axis by grouping the employees by Bradford class (by 50) and comparing the percentage of cumulative classes. The first class (Bradford between 0 and 50) has 1,727 employees or 70% of the total population in the company. The second class (Bradford between 50 and 100) has 233 employees, i.e. 9.38% of the total population in the company, and so on. Here it is a question of controlling that a majority of the total population belongs to a low Bradford class (for example less than 150).
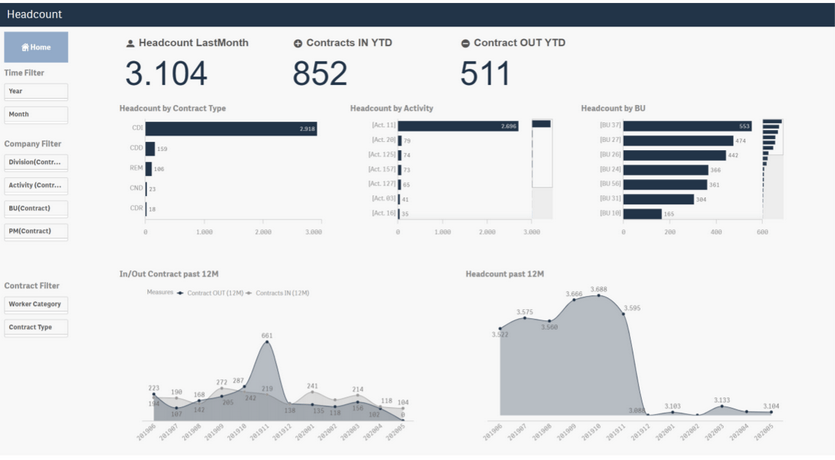
Headcount
The headcount is the calculation of which can be more complex. This involves calculate at time T the number of persons employed by the corporation based on the start and end dates of their contracts. In addition to this, additional conditions can be added, such as the presence of planned hours for the current or next month. In this way, employees whose contracts are still running without any real activity in the company (such as long-term sick employees) are not taken into account.
This requires for each contract to know all the dates for which the employee was active as well as the history of the schedules linked to this contract. Such a calculation is practically impossible without a BI tool. The dashboard below analyses both the evolution of the number of employees over time (last 12 months) and the distribution of these employees – for the most recent period – by type of contract, activity and business unit.
In addition to knowing the number of people active at a given time T and over time, this dashboard allows the company to know the number of incoming and outgoing contracts on a monthly basis (number of contracts whose start or end date corresponds to the month of observation). This makes it possible to control the staff growth rate.
Conclusion
Qlik provides companies with a tool for calculating and aggregating data that allows more frequent – even real-time – analysis and thus increases the reactivation of companies. Indeed, the often complex and tedious calculations that used to take several days or weeks to complete can now be automated. The decision-making process being faster, it’s the whole organization becoming more agile.
Don’t hesitate to contact us to discuss it!
Nos derniers articles :
- WeQan News ! September 2022
- What is Qlik Reporting Service ?
- Qlik Sense Cloud Release Note – September 2022
laetitia.larchanche@weqan.be
+32(0)489/970.736
Laetitia, Sales & Marketing Manager
Keep up to date with the latest WeQan news by following us on LinkedIn and Facebook.