
Introduction
Microsoft’s Power BI platform continues to evolve, bringing with it a host of new features designed to enhance user experience, streamline workflows, and optimize performance. In this article, we delve into some of the recent updates to Power BI that are set to revolutionize the way users interact with data and reports. From improved slicer functionality to hybrid tables, seamless integration with cloud storage, and enhanced editing capabilities, these features are poised to take data analysis and visualization to new heights.
Apply All Slicers Button: Redefining Interactivity and Performance
The new “Apply all slicers” button introduces a groundbreaking approach to interactivity within Power BI reports. This feature allows report creators to control when slicer selections are applied, reducing the frequency of visual refreshes while users make selections across multiple slicers. This not only enhances the user experience by providing a smoother and more responsive interface but also significantly improves performance by minimizing the load on visuals during complex interactions. By giving users the power to synchronize slicer selections at their discretion, the “Apply all slicers” button empowers them to make more informed decisions without compromising performance.

Hybrid Tables: Bridging the Gap Between DirectQuery and Import
The introduction of hybrid tables marks a pivotal step forward in bridging the gap between DirectQuery and import data connectivity. This feature enables users to combine data from both sources seamlessly, leveraging the strengths of each approach while mitigating their respective limitations. By fusing the benefits of real-time data access through DirectQuery with the robust modeling and calculation capabilities of import, Power BI users gain unprecedented flexibility in designing data models that suit their analytical needs. This innovation promises to redefine the way organizations handle data integration and achieve a more holistic understanding of their data landscape.
Measure Driven Data Labels: Elevating Data Visualization Precision
Power BI’s commitment to data visualization accuracy is further exemplified by the introduction of measure driven data labels. This feature empowers users to apply data labels based on measures, allowing for dynamic and contextually relevant labeling of visual elements. By leveraging measures to dictate the display of data labels, report creators can enhance clarity and precision, ensuring that insights are effectively communicated to audiences. This capability not only streamlines the design process but also enhances the interpretability of visualizations, enabling users to extract more meaningful insights from their data.
e.g.: a column with different current currencies can easily be displayed
Seamless Integration with OneDrive and SharePoint: Unifying Desktop and Services
In a bid to eliminate confusion and create a consistent experience, Power BI now seamlessly integrates with both OneDrive and SharePoint. This update brings Power BI Desktop’s capabilities in line with those of Power BI Services, ensuring that users can work with their files in a familiar and synchronized environment regardless of the platform they are using. This unified approach fosters collaboration, facilitates file sharing, and streamlines workflows, enhancing the overall user experience and simplifying the transition between design and deployment phases.
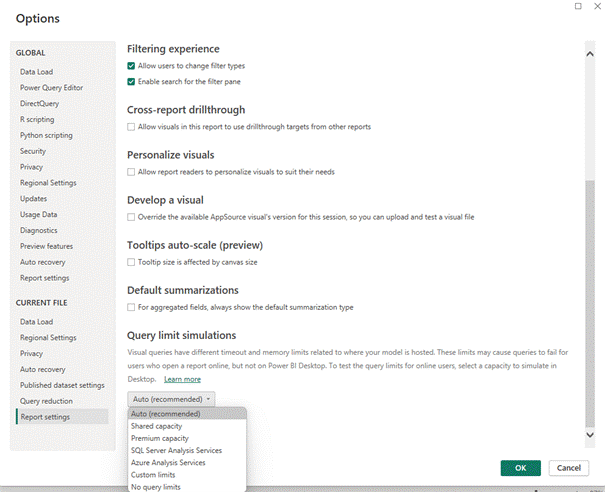
Set Query Limits in Power BI Desktop: Enhancing Performance Optimization
Recognizing the importance of optimizing performance, Power BI introduces the ability to set query limits directly within Power BI Desktop. This feature empowers report creators to define query constraints that mirror the behavior of Power BI Services, ensuring consistency between development and deployment environments. By fine-tuning query limits during the design phase, users can proactively identify and address potential performance bottlenecks, resulting in smoother interactions and improved user satisfaction.
e.g.: limitation message that could pop-up online without considering query limits

How to fix the query limit :
Edit Your Data Model in the Power BI Service (Opt-in): Empowering Mac Users
For Mac users, the introduction of the “Edit your data model in the Power BI Service” feature represents a significant leap forward. This option provides Mac users with the ability to edit and enhance their data models directly within the Power BI Service, eliminating the need for a Windows-based environment. This empowers Mac users to fully leverage the capabilities of Power BI, ensuring a seamless experience regardless of the operating system they are using. By enabling data model editing on the Power BI Service, Microsoft demonstrates its commitment to inclusivity and usability across diverse user groups.
Conclusion
The latest features introduced in Power BI underscore Microsoft’s dedication to delivering a cutting-edge platform that empowers users to analyze, visualize, and communicate data effectively. From enhanced interactivity through the “Apply all slicers” button to the game-changing hybrid tables, measure-driven data labels, and seamless integration with cloud storage, these updates promise to improve the way data professionals approach their work. Furthermore, the focus on performance optimization and cross-platform accessibility ensures a consistent and enriched user experience.
See you soon !
To discover our other articles on Power BI, it’s here
Ps : Pour découvrir nos autres articles sur Power BI, c’est ici :
- News in Power BI – February 2023
- What’s new on Power BI in the last quarter ?
- The different Microsoft Power BI licenses
- How does BI support the retail sector through key indicators?

![]()
![]()
![]()